Image Details
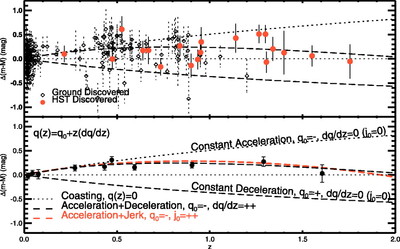
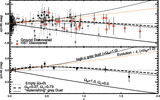
Caption: Fig. 6.
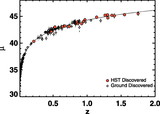
Kinematic SN Ia residual Hubble diagram. Top: SNe Ia from ground‐based discoveries in the gold sample are shown as diamonds; HST‐discovered SNe Ia are shown as filled symbols. Bottom: Weighted averages in fixed redshift bins are given for illustrative purposes only. Data and kinematic models of the expansion history are shown relative to an eternally coasting model, ﹩q( z) =0﹩. Models representing specific kinematic scenarios (e.g., "constant acceleration") are illustrated.
Other Images in This Article
Show More
Copyright and Terms & Conditions
© 2004. The American Astronomical Society. All rights reserved. Printed in U.S.A.
Copyright ©
2026 Astronomy Image Explorer. All Rights Reserved.