Image Details
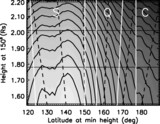
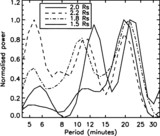
Caption: Fig. 5.
Filtered global spectra from slit pixels for the 2.0 R⊙ observation arranged in a contour plot. Left: Global spectra across the whole slit. Right: Global spectra from the region between 161° and 181°, with a lower filter threshold than that used for the left panel.
Other Images in This Article
Show More
Copyright and Terms & Conditions
© 2004. The American Astronomical Society. All rights reserved. Printed in U.S.A.
Copyright ©
2025 Astronomy Image Explorer. All Rights Reserved.