Image Details
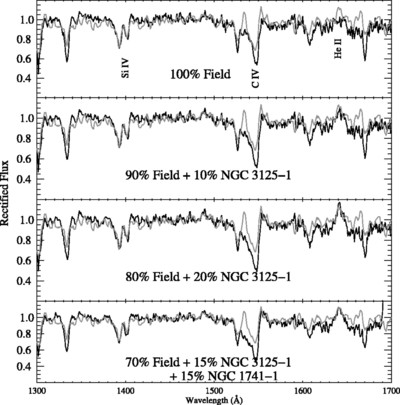
Caption: Fig. 3.
Comparison of the Lyα absorption+emission spectrum from Shapley et al. (2002) with empirical rest‐frame UV templates created from local starbursts. All panels show the rectified high‐redshift LBG spectrum (gray) with that from different combinations of our templates (black): top, 100% field spectrum; second from top, 90% "field" + 10% NGC 3125‐1 contribution; third from top, 80% field + 20% NGC 3125‐1 contribution; bottom, 70% field + 15% NGC 3125‐1 + 15% fraction of cluster NGC 1741‐1.
Other Images in This Article
Copyright and Terms & Conditions
© 2004. The American Astronomical Society. All rights reserved. Printed in U.S.A.
Copyright ©
2025 Astronomy Image Explorer. All Rights Reserved.