Image Details

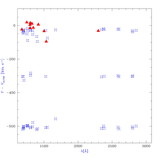
Caption: Fig. 7.
Velocity of ISM and stellar lines of NGC 1705‐1 vs. lower ionization potential. Symbols as in Fig. 6. The point at (16.35, −14) denotes the two Si III lines at 1297 and 1343 Å, for which we measured the same velocity. The lowest velocity value for the stellar lines corresponds to the faint Si II line at 1533 Å.
Other Images in This Article
Show More
Copyright and Terms & Conditions
© 2004. The American Astronomical Society. All rights reserved. Printed in U.S.A.
Copyright ©
2025 Astronomy Image Explorer. All Rights Reserved.