Image Details
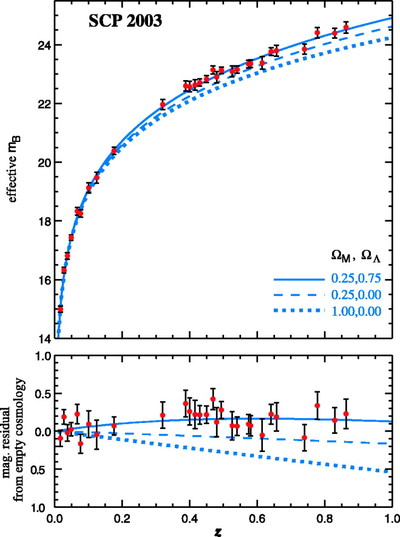
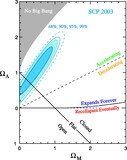
Caption: Fig. 5.
Top: Averaged Hubble diagram with a linear redshift scale for all SNe from our low‐extinction subsample. Here SNe within ﹩\Delta z< 0.01﹩ of each other have been combined using a weighted average in order to more clearly show the quality and behavior of the data set. (Note that these averaged points are for display only and have not been used for any quantitative analyses.) The solid curve overlaid on the data represents our best‐fit flat‐universe model, ﹩( \Omega _{M},\Omega _{\Lambda }) =( 0.25,\ 0.75) ﹩ (fit 3 of Table 8). Two other cosmological models are shown for comparison: ﹩( \Omega _{M},\Omega _{\Lambda }) =( 0.25,\ 0) ﹩ and ﹩( \Omega _{M},\Omega _{\Lambda }) =( 1,\ 0) ﹩. Bottom: Residuals of the averaged data relative to an empty universe, illustrating the strength with which dark energy has been detected. Also shown are the suite of models from the top panel, including a solid curve for our best‐fit flat‐universe model.
Other Images in This Article
Show More
Copyright and Terms & Conditions
© 2003. The American Astronomical Society. All rights reserved. Printed in U.S.A.