Image Details
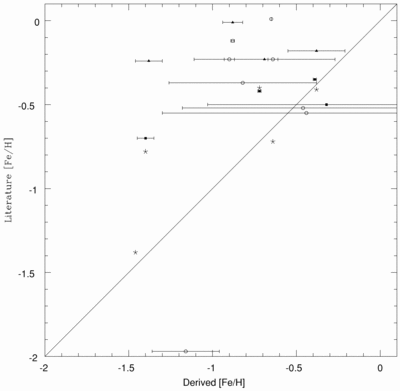
Caption: Fig. 23.
Final derived metallicities for the MC clusters are plotted vs. the Olszewski et al. (1991) values from Table 2. The data are divided into three age bins. Specifically, the open circles represent the youngest clusters with ages less than 9.1 in the log. The filled squares represent clusters with ages between 9.1 and 9.3 in the log, and the filled triangles are for the oldest clusters with ages (in gigayears) greater than 9.3 in the log. The solid line shows the identity line. The derived metallicities are systematically more metal‐poor than the Olszewski et al. (1991) metallicities. Asterisks denote metallicity determinations in common with the Beasley et al. (2002) results.
Other Images in This Article

Show More
Copyright and Terms & Conditions
© 2003. The American Astronomical Society. All rights reserved. Printed in U.S.A.