Image Details
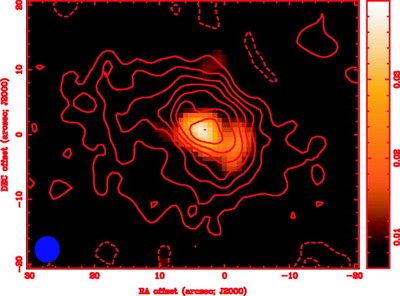
Caption: Fig. 1.
Color image of the 3.4 mm continuum emission of NGC 7538S overlaid with contours of H13CN ﹩J=1\rightarrow 0﹩ emission integrated over the velocity range from −70 to −40 km s﹩^{-1}﹩. The maps are offset (−3﹩\farcs﹩7, −0﹩\farcs﹩5) from the 3.4 mm peak: α(2000.0) = 23h13m44﹩\fs﹩98, δ(2000.0) = +61°26﹩\arcmin﹩49﹩\farcs﹩2. The intensity scale for the continuum is in Jy beam−1. The contours for the H13CN emission go from −6 K km s﹩^{-1}﹩ (dotted contours) to 6 K km s﹩^{-1}﹩ with steps of 6 K km s﹩^{-1}﹩. The beam FWHM is plotted in blue.
Other Images in This Article
Copyright and Terms & Conditions
© 2003. The American Astronomical Society. All rights reserved. Printed in U.S.A.
Copyright ©
2025 Astronomy Image Explorer. All Rights Reserved.