Image Details
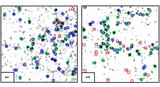
Caption: Fig. 13.
Richness estimator tests using Abell clusters with spectroscopic redshifts. Panel (a) shows our richness measure using the spectroscopic redshift from SR99 compared with the richness using our photo‐z. Panel (b) is the ratio of richnesses using 1.5 and 1 Mpc radii. Panel (c) shows our richness (using zspec) against Abell’s. Panel (d) compares Abell’s richness with our measurement using the Kim (2001) technique to count galaxies with m3 < m < m3 + 2. In the bottom panels, each small dot is a single cluster, with the large squares representing binned data.
Other Images in This Article

Show More
Copyright and Terms & Conditions
© 2003. The American Astronomical Society. All rights reserved. Printed in U.S.A.
Copyright ©
2025 Astronomy Image Explorer. All Rights Reserved.