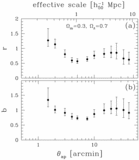
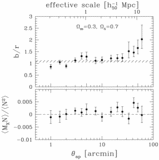
Image Details
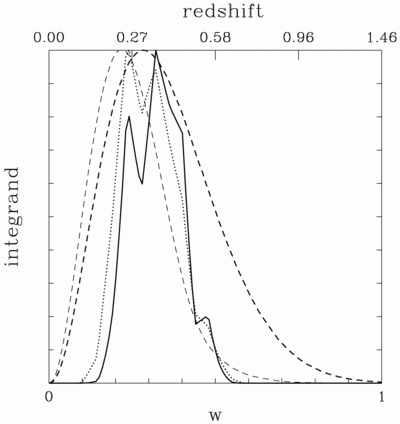
Caption: Fig. 1.
Different integrands of the integrals in eqs. (14) and (17) for a fiducial aperture size ﹩\theta _{\mathrm{ap}\,}=5^{\prime }﹩. The integrands have been normalized to have the same maximum value. Thick solid line: ﹩h_{1}( w) ﹩ as a function of w. Upper axis: Corresponding redshift. We used the observed redshift distribution of galaxies with ﹩19.5< R_{C}< 21﹩ from the CNOC2 survey, which gives rise to the wiggles in the function. This result indicates that we probe the power spectrum (and the bias parameters) at an effective redshift ~0.35. Thick dashed line: ﹩h_{2}( w) ﹩ for the VIRMOS‐DESCART survey. This function is rather broad, which reflects the fact that weak lensing probes the power spectrum over a relatively large redshift range. However, comparison with the integrand for the galaxy autocorrelation function shows that both peak at the same redshift. Hence, we can use the ratio of ﹩\langle \mathstrut{\cal N} ^{2}\rangle ﹩ and ﹩\langle M^{2}_{\mathrm{ap}\,}\rangle ﹩ measured at the same aperture size ﹩\theta _{\mathrm{ap}\,}﹩. The same integrand using the RCS background galaxy redshift distribution gives the thin dashed line, which is a poor match to galaxy autocorrelation function. Dotted line: Integrand for the galaxy‐mass cross‐correlation function, ﹩h_{3}( w) ﹩, which overlaps well with the galaxy autocorrelation function.
Other Images in This Article
Copyright and Terms & Conditions
© 2002. The American Astronomical Society. All rights reserved. Printed in U.S.A.