Image Details

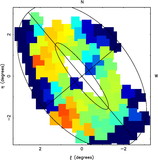
Caption: Fig. 4.
Examples of two color‐magnitude diagrams from our WFC survey. Left, field in the giant stellar stream; right, field in the G1 clump. Overplotted are the same globular cluster fiducial sequences as shown in Fig. 1. Many of the stars more luminous than the RGB tip are foreground contaminants. Stellar density varies between the CMDs as a result of the different overdensities of the features. We argue that the different mean colors and widths of the RGB primarily reflect intrinsic metallicity variations.
Other Images in This Article
Copyright and Terms & Conditions
© 2002. The American Astronomical Society. All rights reserved. Printed in U.S.A.
Copyright ©
2025 Astronomy Image Explorer. All Rights Reserved.