Image Details
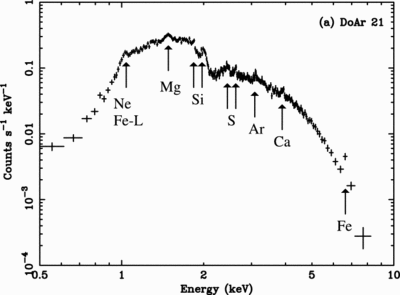
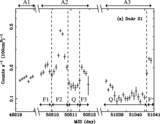
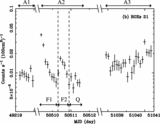
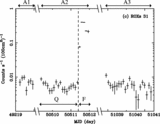
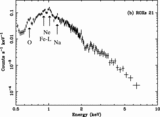
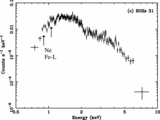
Caption: Fig. 3.
Time‐averaged X‐ray spectra of (a) DoAr 21, (b) ROXs 21, and (c) ROXs 31 obtained with Chandra ACIS‐I (observation C1). The prominent spectral features are indicated by the arrows and the corresponding elements.
Other Images in This Article
Show More
Copyright and Terms & Conditions
© 2002. The American Astronomical Society. All rights reserved. Printed in U.S.A.
Copyright ©
2025 Astronomy Image Explorer. All Rights Reserved.