Image Details
Caption: Fig. 5.
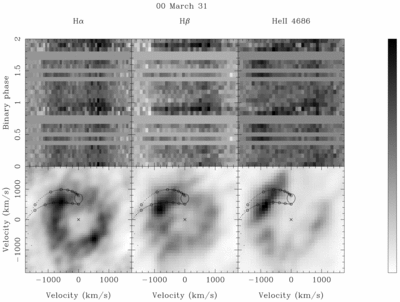
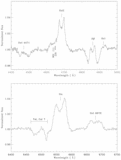
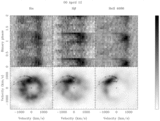
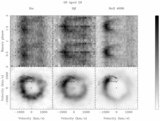
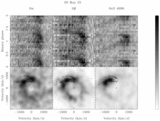
Top panels present (from left to right) the trailed spectrograms of Hα, Hβ, and He II λ4686. Empty strips represent gaps in the phase coverage. For the sake of clarity, the same cycle has been plotted twice. Lower panels show the computed MEM Doppler maps. The Roche lobe of the secondary star, the predicted velocities of the gas stream (lower curve) and of the disk along the stream (upper curve) are plotted for ﹩K_{2}=698﹩ km s−1 and ﹩q=0.07﹩. Distances in multiples of 0.1RL1 are marked along both curves with open circles. The center of mass of the system is denoted by a cross.
Other Images in This Article
Copyright and Terms & Conditions
© 2002. The American Astronomical Society. All rights reserved. Printed in U.S.A.
Copyright ©
2025 Astronomy Image Explorer. All Rights Reserved.