Image Details
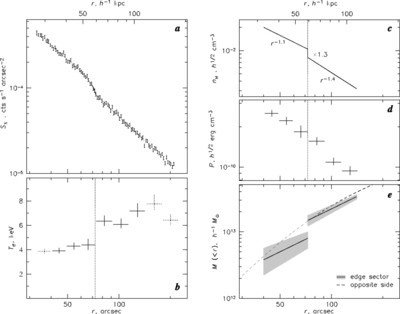
Caption: Fig. 2.
Profiles from the southern 60° sector containing the edge. Errors are 68%. The vertical dotted lines show the edge position. (a) Surface brightness in the 0.7–5 keV band. The line is a fit in the ﹩r=40^{\prime \prime }{\mbox{--}} 140^{\prime \prime }﹩ range; the corresponding density model is shown in (c). (b) Temperature profile with approximate deprojection (see text). The solid crosses show values used for the derivation of the pressure and total mass across the edge. (d) Pressure profile. (e) Total mass within a given radius (confidence bands are shown in gray). For comparison, a fit in the sector opposite to the edge (see Figs. 1b and 3) is shown by a dashed line; they must show the same mass if the gas is in hydrostatic equilibrium.
Other Images in This Article

Copyright and Terms & Conditions
© 2001. The American Astronomical Society. All rights reserved. Printed in U.S.A.