Image Details
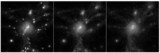
Caption: Fig. 2.
Profiles of specific entropy in units of ﹩T_{\mathrm{ew}\,}﹩. The three panels, from left to right, correspond to the same heating schemes as in Fig. 1. The solid, short‐dashed, and long‐dashed curves are for the Virgo Cluster, the Fornax group, and the Hickson group, respectively. Each profile is shown down to the radius encompassing 100 gas particles, which is taken as the smallest scale adequately treated by the SPH scheme. The dotted line in the left panel shows the analytical prediction by TN01 for the profile of entropy induced by gravitational heating.
Other Images in This Article
Copyright and Terms & Conditions
© 2001. The American Astronomical Society. All rights reserved. Printed in U.S.A.
Copyright ©
2025 Astronomy Image Explorer. All Rights Reserved.