Image Details
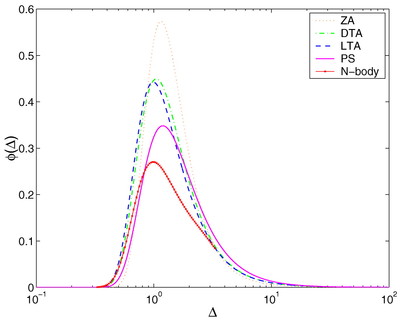
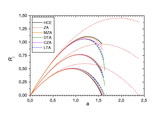
Caption: Fig. 4.
(a) Universal mass function calculated for the ZA (dotted curve), the DTA (dot‐dashed curve), and the LTA (dashed curve). For comparison, we display in this figure the fit to N‐body simulations (crossed curve) obtained by Jenkins et al. (2001), together with the standard PS mass function (solid curve). (b) Same as (a), but now a logarithmic scale is used in the y‐axis. Here the x‐axis scale is limited to the range ﹩0.332\leq \Delta \leq 3.32﹩ covered by the N‐body simulations.
Other Images in This Article

Show More
Copyright and Terms & Conditions
© 2001. The American Astronomical Society. All rights reserved. Printed in U.S.A.
Copyright ©
2025 Astronomy Image Explorer. All Rights Reserved.