Image Details
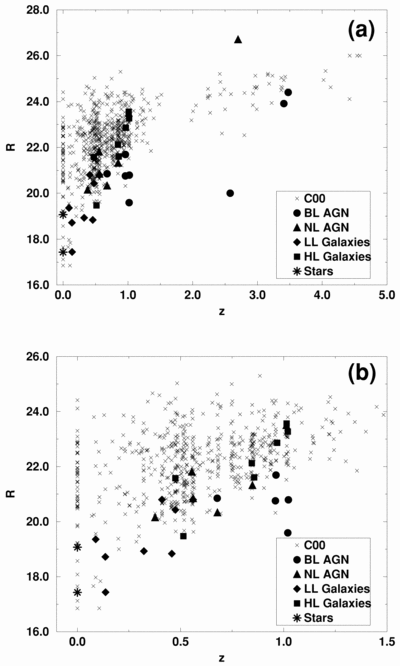
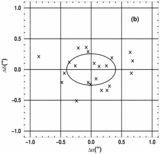
Caption: Fig. 12.
ℛ magnitude vs. redshift for all Chandra sources having spectroscopic identifications, plotted over the redshift catalog of C00. ℛ (H00; see § 4.2) is plotted here for the X‐ray sources in order to make direct comparison with C00, who also use ℛ. Panel (a) shows the total sample of 32 Chandra sources with optical identifications, while panel (b) shows the same data for ﹩0< z< 1.5﹩, where most of the Chandra objects reside. All of the C00 sources at ﹩z=0﹩ are spectroscopically identified stars.
Other Images in This Article

Show More
Copyright and Terms & Conditions
© 2001. The American Astronomical Society. All rights reserved. Printed in U.S.A.
Copyright ©
2025 Astronomy Image Explorer. All Rights Reserved.