

Image Details
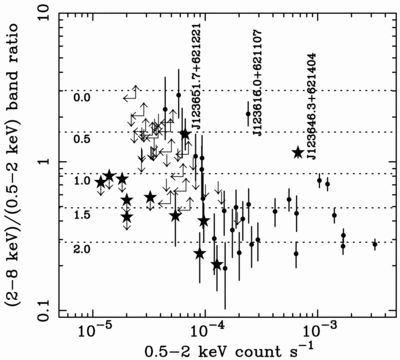
Caption: Fig. 9.
Band ratio as a function of soft‐band (0.5–2.0 keV) count rate for Chandra sources. Plotted are the 479.7 ks Chandra sources in Table 2 (stars), as well as the other sources studied by H01 with 221.9 ks (circles). Plain arrows indicate limits. Dotted lines are labeled with the photon indices corresponding to a given band ratio (assuming only Galactic absorption). Note that the faintest HDF‐N sources occupy a region at low count rate and relatively low band ratio that has not, until now, been seen for individual sources. Only one source presented in this paper is not plotted here; this source, CXOHDFN J123649.5+621345, was detected only in the full band.
Other Images in This Article
Show More
Copyright and Terms & Conditions
© 2001. The American Astronomical Society. All rights reserved. Printed in U.S.A.

