

Image Details
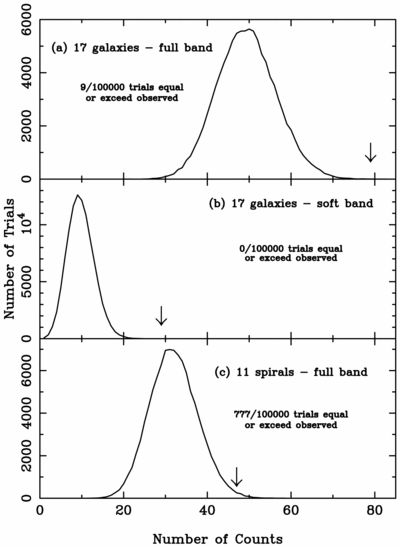
Caption: Fig. 12.
Results from our Monte Carlo testing of the galaxy stacking analysis. For each plot we have performed 100,000 stacking trials at randomly selected positions, and we plot the number of trials yielding a given number of counts in the 30 pixel source region described in § 3.4.1. Arrows in each plot show the number of counts actually observed when the stated galaxies were stacked (Nobs). (a) full‐band stacking of the 17 galaxies in Table 4, (b) soft‐band stacking of the 17 galaxies in Table 4, and (c) full‐band stacking of the 11 spiral galaxies in Table 4. For each plot we state the number of random trials yielding ≥Nobs counts.
Other Images in This Article
Show More
Copyright and Terms & Conditions
© 2001. The American Astronomical Society. All rights reserved. Printed in U.S.A.

