

Image Details
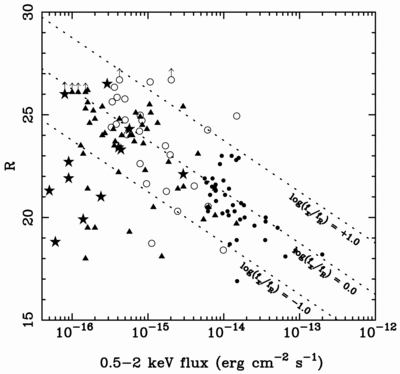
Caption: Fig. 10.
Plot of R magnitude vs. 0.5–2.0 keV flux for X‐ray sources. Plotted are the 12 Chandra HDF‐N area sources in Table 2 that are detected in the soft band (stars), the 221.9 ks Chandra sources from H01 (triangles), the 100 ks Chandra sources from Mushotzky et al. (2000; open circles), and the ROSAT sources from Schmidt et al. (1998; filled circles). The slanted lines have been calculated following § 5.1 of H01; they show the typical range of X‐ray–to–R‐band flux observed for luminous AGNs in the local universe.
Other Images in This Article
Show More
Copyright and Terms & Conditions
© 2001. The American Astronomical Society. All rights reserved. Printed in U.S.A.

Copyright ©
2026 Astronomy Image Explorer. All Rights Reserved.
