Image Details
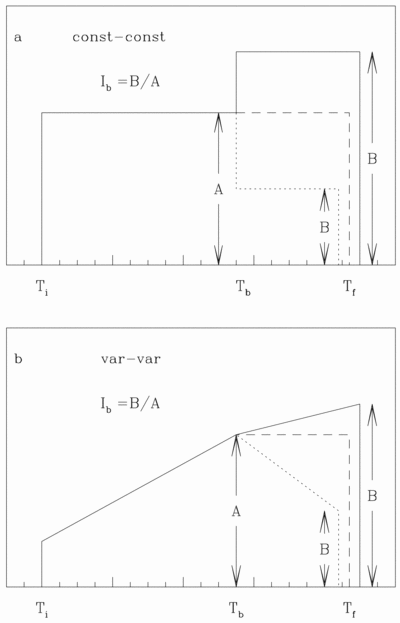
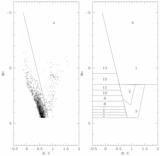
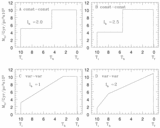
Caption: Fig. 2.
(a) Shape of the SFR, as described in § 3.2 for the const‐const model, where Tb is the time of the rate change and Ib is the ratio of the SFR at the final time, Tf, to its value at Tb. (b) Same as (a), but for the var‐var model. In both panels the final time, Tf, is the same for all the shapes, but it is plotted separately for clarity.
Other Images in This Article

Copyright and Terms & Conditions
© 2001. The American Astronomical Society. All rights reserved. Printed in U.S.A.
Copyright ©
2025 Astronomy Image Explorer. All Rights Reserved.