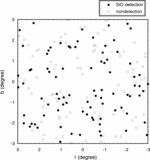
Image Details
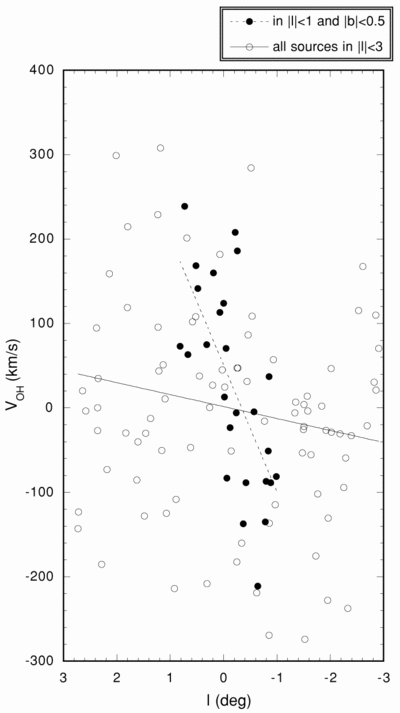
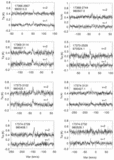
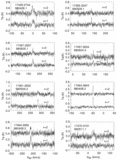
Caption: Fig. 8.
Longitude–velocity diagram of the doubly peaked OH 1612 MHz sources (Sevenster et al. 1997). The filled and unfilled circles indicate the sources in the central nuclear disk (﹩\vert l\vert < ﹩1° and ﹩\vert b\vert < ﹩﹩0\fdg 5﹩ in Fig. 7) and elsewhere, respectively. Least‐squares fits are shown for the nuclear disk sources (broken line) and all the OH 1612 MHz sources in ﹩\vert l\vert < 3﹩° and ﹩\vert b\vert < 3﹩° (thin line).
Other Images in This Article
Show More
Copyright and Terms & Conditions
© 2000. American Astronomical Society. All rights reserved. Printed in U.S.A.
Copyright ©
2025 Astronomy Image Explorer. All Rights Reserved.