Image Details
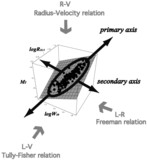
Caption: Fig. 2.
Comparison of observed (upper panels) and simulated (lower panels) galaxies in the Tully‐Fisher projection (left panels) and edge‐on projection (right panels) of the scaling plane. The slopes of all the lines are determined by fitting to the observation. In the lower panels, the dotted lines represent the observed correlation (as do the solid lines in the upper panels), and the zero points of the solid lines are shifted by eye to fit them to the simulations. The ranges of axes are different between upper and lower panels, but the lengths of axes are exactly the same. Hence we can compare the slope and scatter of the observations and the simulations. In the Tully‐Fisher projection of simulated galaxies (lower left), the axes along mass and spin parameter are indicated by two arrows. Comparing lower left and lower right panels, we find that the scaling plane would originate from the difference of galactic mass and spin parameter.
Other Images in This Article
Copyright and Terms & Conditions
© 2000. The American Astronomical Society. All rights reserved. Printed in U.S.A.