

Image Details
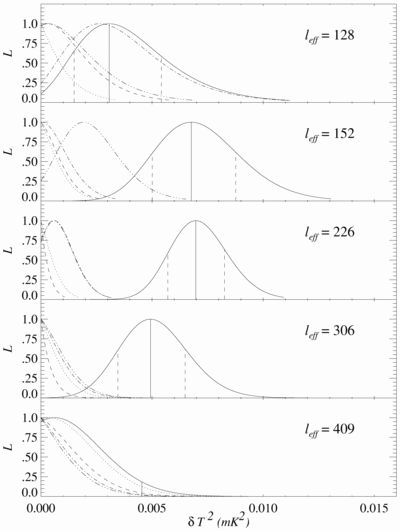
Caption: Fig. 1.
Likelihood of the combined D1 and D2 analysis (solid line) as a function of ﹩\delta T^{2}_{l}﹩. The null tests: quadrature (signal with chopper sweeping one direction minus that with the chopper sweeping the other direction; dotted line), fast and slow dither (differences of subsequent 0.5 and 10 s averages, dashed and dash‐doted lines, respectively), and first half minus second half (triple‐dot–dashed line) are also shown. The vertical lines indicate the maximum, ±1 σ, or 95% confidence upper bound.
Other Images in This Article
Copyright and Terms & Conditions
© 1999. The American Astronomical Society. All rights reserved. Printed in U.S.A.

Copyright ©
2026 Astronomy Image Explorer. All Rights Reserved.
