Image Details
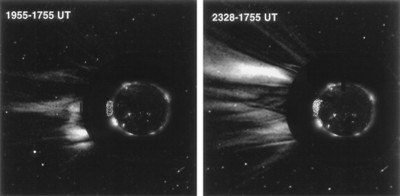
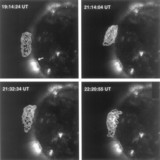
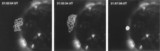
Caption: Fig. 3.
SOHO LASCO C2 coronagraph images, compared with EIT Fe XII (195 Å) images and VLA 400 cm maps. The LASCO image on the left, formed from the difference of images taken at the UT times in the upper left‐hand corner, shows a coronal mass ejection whose outward motion was estimated from successive difference images at a velocity of 305 km s−1. It probably coincided with a disk event occurring at 19:14 UT, the time of the VLA and EIT images. The LASCO difference images on the right, also taken from times denoted in the upper left‐hand corner, is compared with VLA and EIT data taken at 22:21 UT.
Other Images in This Article
Copyright and Terms & Conditions
© 1998. The American Astronomical Society. All rights reserved. Printed in U.S.A.
Copyright ©
2025 Astronomy Image Explorer. All Rights Reserved.