Image Details
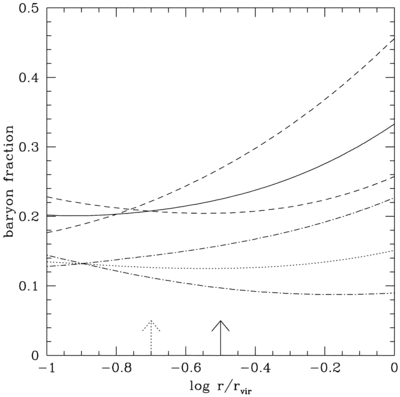
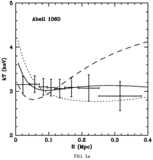
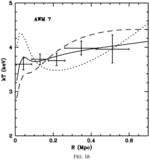
Caption: Fig. 2.
Enclosed baryon fractions vs. radius in units of the virial radius in A1060 and AWM 7. For A1060, the dotted line represents the best‐fit mass model, the dot‐dashed lines the most compact and diffuse models; for AWM7, the solid line represents the best‐fit mass model, the dashed lines the most compact and diffuse models. The compact model lines lie above the best fits. Arrows at the bottom of the plot show the approximate positions of the outermost radii where ASCA temperatures have been obtained.
Other Images in This Article
Copyright and Terms & Conditions
©1996. The American Astronomical Society. All rights reserved. Printed in U.S.A.
Copyright ©
2025 Astronomy Image Explorer. All Rights Reserved.