Image Details
Caption: Fig. 2.
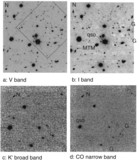
Spectral energy distribution for MTM 095355+545428 compared to the spectral synthesis models of Bruzual and Charlot. Photometric data points are plotted with vertical error bars indicating uncertainty and horizontal bars indicating filter width. The B and R points are derived from the LRIS spectrum, rather than photometry, and are less certain.
Other Images in This Article
Copyright and Terms & Conditions
©1996. The American Astronomical Society. All rights reserved. Printed in U.S.A.
Copyright ©
2025 Astronomy Image Explorer. All Rights Reserved.