Image Details
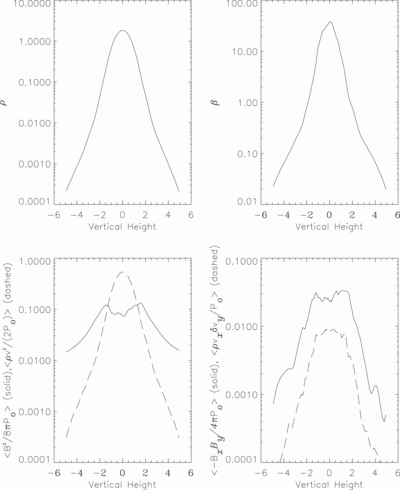
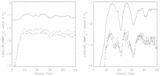
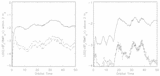
Caption: Fig. 2.
Vertical variation of horizontally and temporally averaged quantities in model BY1. The time average is constructed between orbits 25–50. The horizontal average is taken over the ﹩\hat{\boldsymbol{r}}\hat{\mathstrut{{\boldsymbol{\phi}}} }﹩ plane as described in the text.
Other Images in This Article
Show More
Copyright and Terms & Conditions
© 2000. The American Astronomical Society. All rights reserved. Printed in U.S.A.
Copyright ©
2025 Astronomy Image Explorer. All Rights Reserved.