Image Details
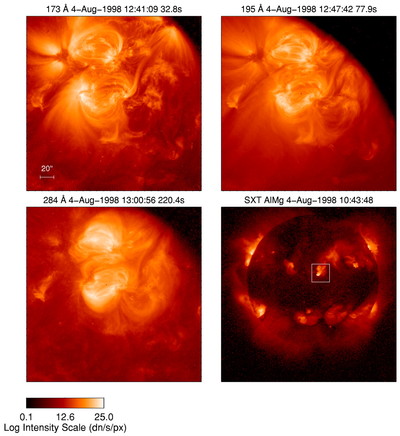
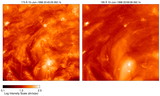
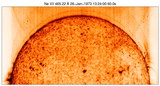
Caption: Fig. 4.
TRACE images of a disk active region. The images are displayed in a logarithmic intensity scale. (a) Image in the wavelength band centered at 173 Å; (b) image in the wavelength band centered at 195 Å; (c) image in the wavelength band centered at 284 Å. A color version of this figure appears in the online edition of the Astrophysical Journal.
Other Images in This Article
Copyright and Terms & Conditions
© 1999. The American Astronomical Society. All rights reserved. Printed in U.S.A.
Copyright ©
2025 Astronomy Image Explorer. All Rights Reserved.