Image Details
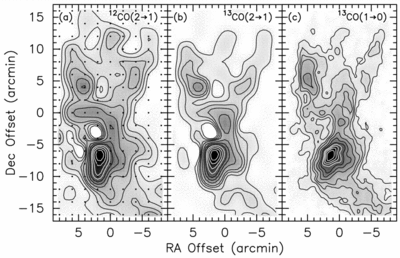
Caption: Fig. 1.
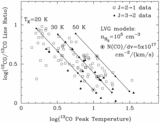
12CO ﹩J=2\rightarrow 1﹩, 13CO ﹩J=2\rightarrow 1﹩, and 13CO ﹩J=1\rightarrow 0﹩ integrated intensity of the M17 giant molecular cloud, measured in the hybrid temperature scale described in § 2 over the velocity range 10–30 km s−1. The (0, 0) position corresponds to ﹩\alpha ( 1950) =1﹩8h17m21﹩\fs﹩0, ﹩\delta ( 1950) =-1﹩6°06﹩\arcmin﹩ 45﹩\arcsec﹩, and the peak of the photon‐dominated region M17 SW lies at offset (2, −6). The contour levels are 5%, 10%, 15%, 20%, 30%, 40%, 50%, 60%, 70%, 80%, and 90% of the map peak intensity. (a) The 12CO ﹩J=2\rightarrow 1﹩ integrated intensity map. Spectra were obtained in a 22﹩\arcsec﹩ beam and sampled on a 2﹩\arcmin﹩ grid, shown as dots in the figure. The map was produced by interpolating the original data onto a 30﹩\arcsec﹩ grid using a bicubic spline algorithm. The map peak intensity is 639 K km s−1, about 7% higher than the peak intensity measured in the 22﹩\arcsec﹩ JCMT beam. (b) The 13CO ﹩J=2\rightarrow 1﹩ integrated intensity map. The map was produced in the same manner as the 12CO map. The map peak intensity is 233 K km s−1, about 10% higher than the peak intensity measured in the 22﹩\arcsec﹩ JCMT beam. (c) The 13CO ﹩J=1\rightarrow 0﹩ integrated intensity map. Spectra were obtained in a 47﹩\arcsec﹩ beam sampled on a 25﹩\arcsec﹩ grid. The data were smoothed to 1﹩\arcmin﹩ resolution in producing the final map. The map peak intensity is 126 K km s−1. Note the good correspondence in the large‐scale structures between the undersampled ﹩J=2\rightarrow 1﹩ maps and this nearly fully sampled map.
Other Images in This Article

Copyright and Terms & Conditions
© 1999. The American Astronomical Society. All rights reserved. Printed in U.S.A.