Image Details
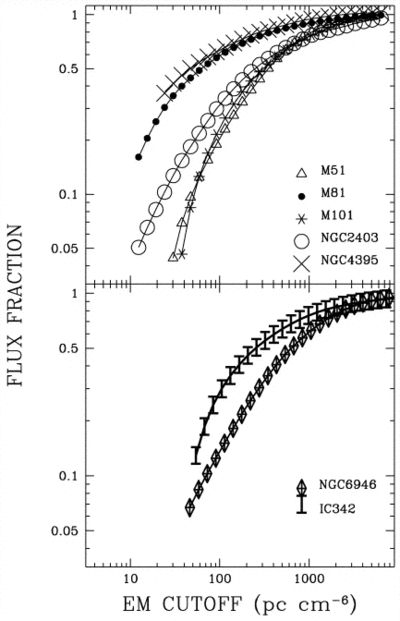
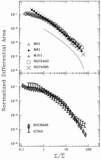
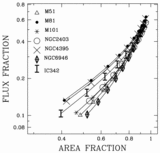
Caption: Fig. 2.
Growth curve of fractional Hα flux as a function of emission measure cutoff for our sample galaxies. Each plotted point corresponds to the relative flux contributed by pixels whose surface brightness lies between −3 σ below the background up to the given surface brightness (emission measure). Symbols for different objects are explained on the figure.
Other Images in This Article

Copyright and Terms & Conditions
© 1999. The American Astronomical Society. All rights reserved. Printed in U.S.A.
Copyright ©
2025 Astronomy Image Explorer. All Rights Reserved.