Image Details
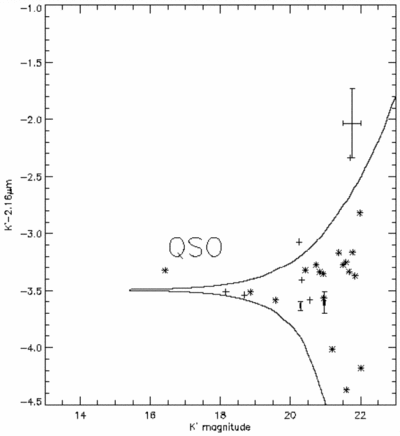
Caption: Fig. 2.
(﹩K^{\prime }﹩‐2.16 μm) vs. ﹩K^{\prime }﹩ for the 1109+4642 field. Objects that were observed twice between 1109 and 1109N are plotted as the average with error bars extended to the individual values. The solid lines denote the 3 σ errors for the 1109 field, not the 1109N field (which are larger). The asterisks indicate objects in the 1109 field and the plus signs indicate objects in 1109N. 1109N was observed in poorer conditions, so the two plus symbols outside the errors are not actually 3 σ detections. The large error bar is the result of the low signal‐to‐noise reobservation of the emission‐line object 1109A
Other Images in This Article


Copyright and Terms & Conditions
© 1999. The American Astronomical Society. All rights reserved. Printed in U.S.A.