Image Details
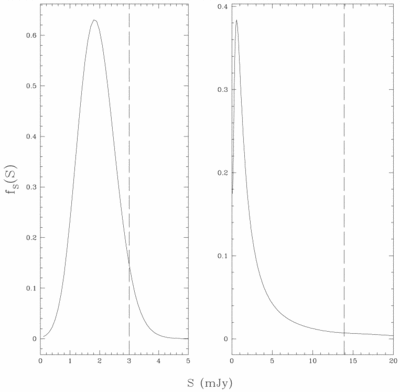
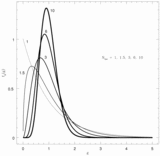
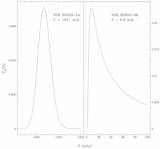
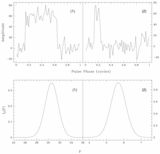
Caption: Fig. 7.
Left: Plot of the composite pdf for source flux density S calculated from all seven Geminga scans, assuming statistical independence among measurements. Right: Plot of the composite pdf for S calculated in the limiting case where the timescale for ISS is longer than the total time of our observation. The dotted lines mark the 95% confidence upper limits.
Other Images in This Article
Copyright and Terms & Conditions
© 1999. The American Astronomical Society. All rights reserved. Printed in U.S.A.
Copyright ©
2025 Astronomy Image Explorer. All Rights Reserved.