Image Details
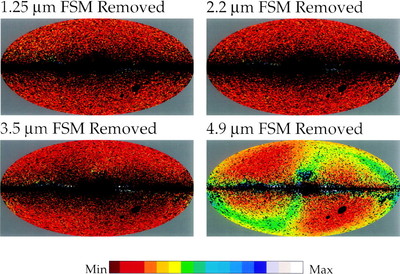
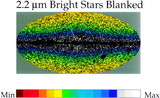
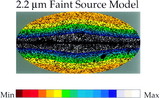
Caption: Fig. 4.
1.25–4.9 μm intensity maps after removal of emission from the IPD and bright and faint Galactic stellar sources. Intensity ranges are the same as in Fig. 1.
Other Images in This Article

Show More
Copyright and Terms & Conditions
© 1998. The American Astronomical Society. All rights reserved. Printed in U.S.A.
Copyright ©
2025 Astronomy Image Explorer. All Rights Reserved.