Image Details
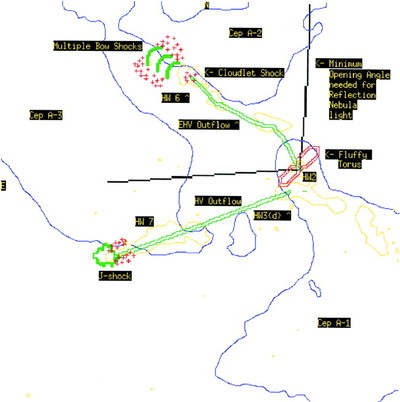
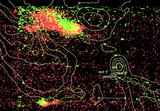
Caption: Fig. 7.
Diagram describing our interpretation of the region. Blue lines: Ammonia contours. Yellow lines: H II contours. Green double lines: Postulated paths of the HV and EHV outflows. Red double lines: Fluffy torus. Green thick lines: [Fe II] emission. Red crosses: Molecular hydrogen emission. Black lines: Minimum opening angle required for light coming from reflection nebula.
Other Images in This Article
Copyright and Terms & Conditions
© 1998. The American Astronomical Society. All rights reserved. Printed in U.S.A.
Copyright ©
2025 Astronomy Image Explorer. All Rights Reserved.