Image Details
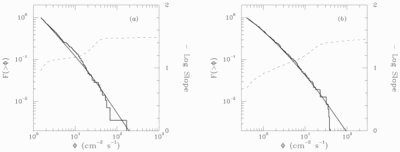
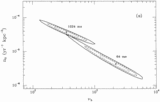
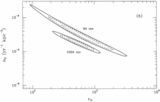
Caption: Fig. 12.
Predicted (smooth curve) and observed (histogram) cumulative intensity distributions of best‐fit two‐population models with luminous halo bursters, for (a) 64 ms and (b) 1024 ms data.
Other Images in This Article
Show More
Copyright and Terms & Conditions
© 1998. The American Astronomical Society. All rights reserved. Printed in U.S.A.
Copyright ©
2025 Astronomy Image Explorer. All Rights Reserved.