Image Details
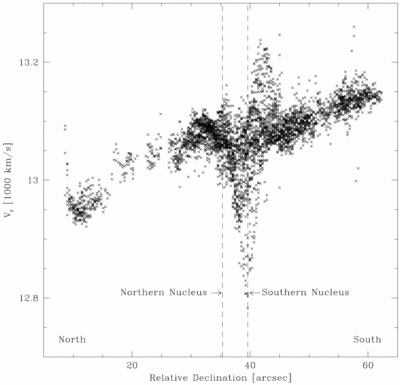
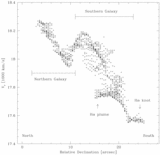
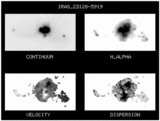
Caption: Fig. 10.
Position‐velocity plot for IRAS 23128−5919. In this plot, the two‐dimensional velocity map has been collapsed in right ascension, yielding velocity as a function of declination. The dashed lines show the position of the two nuclei. A rotating component is clearly seen in the southern galaxy, and there is a weak signature of retrograde motion in the northern galaxy. The velocity gradients in the tails are also well mapped.
Other Images in This Article
Copyright and Terms & Conditions
© 1998. The American Astronomical Society. All rights reserved. Printed in U.S.A.
Copyright ©
2025 Astronomy Image Explorer. All Rights Reserved.