Image Details
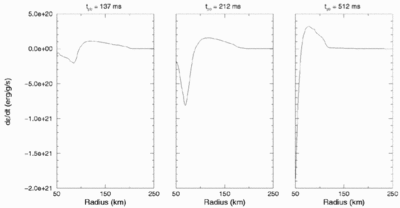
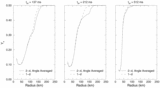
Caption: Fig. 10.
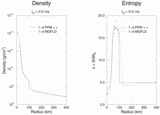
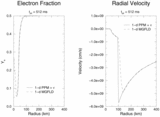
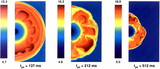
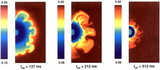
(a) Plots of the angle‐averaged d∊/dt at 137, 212, and 512 ms after bounce; d∊/dt is the net heating or cooling from electron neutrino and antineutrino absorption and emission. (b) Plots of the maximum net neutrino heating and maximum net neutrino cooling rates as a function of time during the course of our simulation. (c) Plots of the maximum net neutrino heating and maximum net neutrino cooling rates as a function of time during the critical 50–150 ms after bounce.
Other Images in This Article

Show More
Copyright and Terms & Conditions
© 1998. The American Astronomical Society. All rights reserved. Printed in U.S.A.
Copyright ©
2025 Astronomy Image Explorer. All Rights Reserved.