Image Details
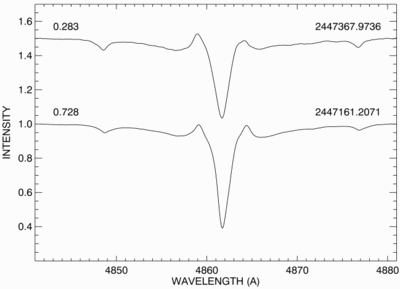
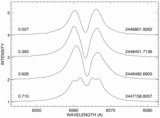
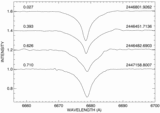
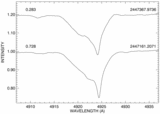
Caption: Fig. 5.
Plot of the long‐term variations in the Hβ line profile in the same format as Fig. 3. The spectra are separated by 50% of the continuum for visual clarity.
Other Images in This Article
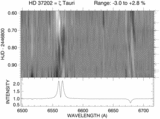
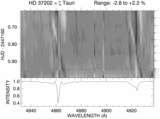

Show More
Copyright and Terms & Conditions
© 1997. The American Astronomical Society. All rights reserved. Printed in U.S.A.
Copyright ©
2025 Astronomy Image Explorer. All Rights Reserved.