Image Details
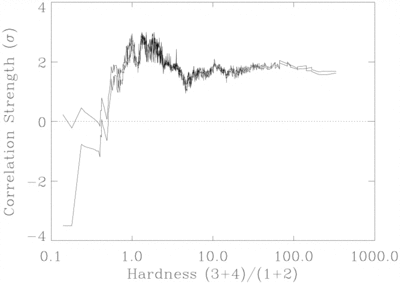
Caption: Fig. 2.
Plot of correlation strength vs. GRB hardness ratio. The correlation significance is computed between ACO clusters and all BATSE 3B GRBs with hardness less than or equal to the plotted value. Soft GRBs show a slight correlation excess.
Other Images in This Article
Copyright and Terms & Conditions
© 1997. The American Astronomical Society. All rights reserved. Printed in U.S.A.
Copyright ©
2025 Astronomy Image Explorer. All Rights Reserved.