Latest Images
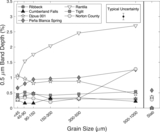
Band center positions of the 0.9 μm absorption ...
VNIR spectra of the three distinct main belt E-...
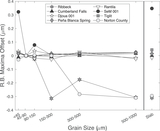
The 9.0 μm Reststrahlen band (R. B.) maxima off...
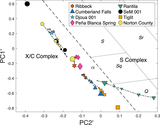
Bus–DeMeo principal component values for all ei...
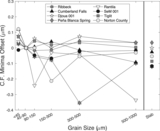
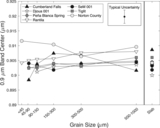
Christiansen feature (C. F.) minima offset rela...
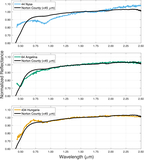
VNIR spectra of two end-member grain sizes of N...
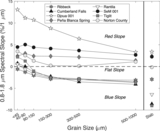
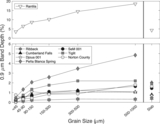
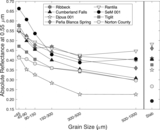
Spectral slope from 0.8 to 1.8 μm as a function...
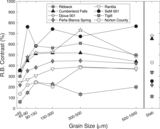
R. B. contrast as a function of grain size for ...
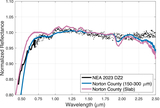
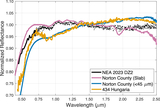
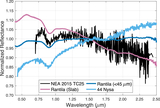
The telescopic spectrum of NEA 2023 DZ2 compare...
Absorption depth of the 0.9 μm low-iron pyroxen...
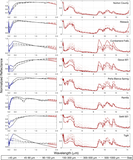
Normalized reflectance of the seven grain size ...
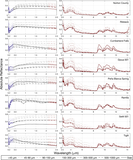
Absolute reflectance of the seven grain size bi...
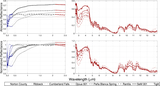
Absolute reflectance (top row) and normalized r...
Absorption depth of the 0.5 μm feature as a fun...
Absolute reflectance values at 0.55 μm (photome...
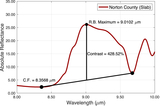
Visual representation of the analysis of MIR fe...
VNIR spectra of the two Rantila grain size end-...
Surface brightness estimates of the ICL at r = ...
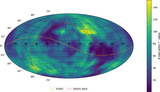
All-sky density plot of the number of identifie...
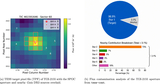
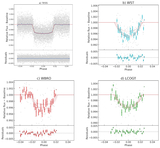
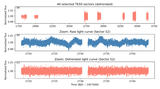
(a) TESS TPF of TOI-2155 (TIC 461591646) from S...
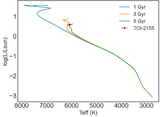
Position of TOI-2155 in the Teff–luminosity pla...
(a) TESS phase-folded data (gray points) with A...
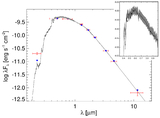
SED of TOI-2155. Red symbols represent the obse...
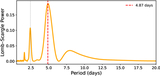
Lomb–Scargle periodogram of the out-of-transit ...
ANNOUNCEMENTS
Take the AstroExplorer for a spin!
Be sure to try the search and sorting features, which were added based on user feedback; browse and find the links to videos and interactive figures in our Journal articles; find AAS Research Notes; or notice that new publishers have begun adding their figures to the AIE. Get in touch to hear more!