

Image Details
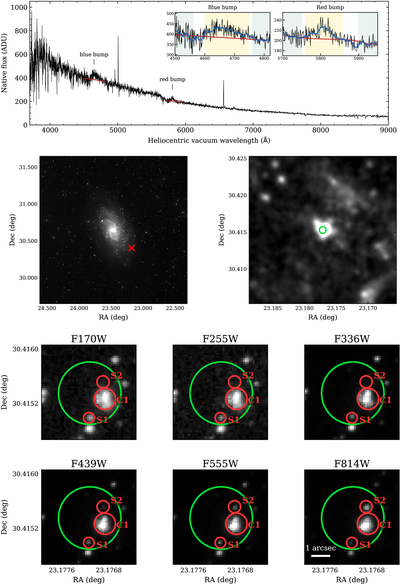
Caption: Figure 1.
Top: LAMOST spectrum (black) and local continuum (red). Enlarged blue and red bump insets overlay the 31-point smoothed spectra (blue) on the original spectra (black). Shading marks the bump (yellow) and continuum (green) windows. Middle: DSS2 views of M33 and the target field. The red cross marks the target, and the green circle outlines the ﹩3\mathop{.}\limits^{{\prime\prime} }3﹩ LAMOST fiber. Bottom: six HST/WFPC2 bands. The green circle again outlines the fiber. Red circles mark S1, S2, and C1 with sizes chosen by eye and held fixed across bands, including non-detections.
Copyright and Terms & Conditions
© 2026. The Author(s). Published by the American Astronomical Society.

Copyright ©
2026 Astronomy Image Explorer. All Rights Reserved.
