

Image Details
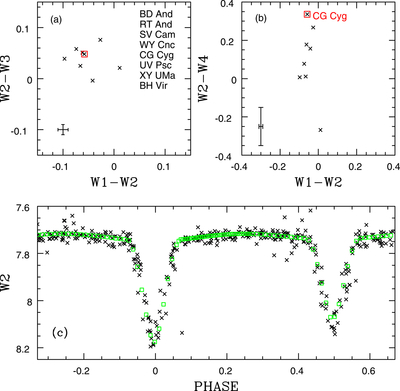
Caption: Figure 1.
(Panels (a) and (b)) Two-color diagrams of selected short period RS CVns. CG Cyg is indicated by an open red square. The error bars are 1σ uncertainty estimates based on the scatter in the outside eclipse CG Cyg measurements, and these are representative of the expected uncertainties in the measurements for the other systems. The W2 − W3 and W2 − W4 colors of CG Cyg differ from those expected from the black body curve of a moderately hot object at just under the 3σ level. The point with the bluest W2 − W4 color in panel (b) is BD And, for which W4 is 1–2 mag fainter than the other stars. (Panel (c)) The W2 LC of CG Cyg (green squares) is compared with the model based on the D. P. Kjurckchieva et al. (2003) solution. The model does not match the depth of secondary minimum, in the sense that the secondary has a higher MIR surface brightness than predicted by standard model atmospheres.
Copyright and Terms & Conditions
© 2026. The Author(s). Published by the American Astronomical Society.

