

Image Details
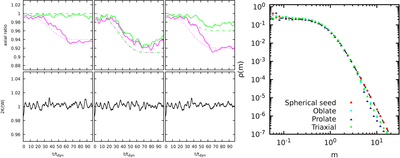
Caption: Figure 1.
Left panel, top: evolution of the axial ratios b/a and c/a. The dashed lines refer to the time-evolved ratios according to Equation (3) while the solid lines highlight the values computed for the time-dependent particle distributions. From left to right the final system is oblate (ϵ = 1; η = 0.06), prolate (ϵ = η = 0.09) and triaxial (ϵ = 0.04; η = 0.08). Left panel, bottom: evolution of the virial ratio. Right panel: density of the final states obtained deforming a realization (red squares) of a Plummer density (dashed line).
Copyright and Terms & Conditions
© 2026. The Author(s). Published by the American Astronomical Society.

Copyright ©
2026 Astronomy Image Explorer. All Rights Reserved.
