

Image Details
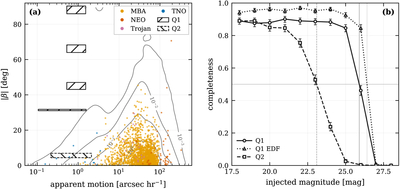
Caption: Figure 1.
(a) The searched parameter space against the cataloged small-body population. Gray contours give the expected number of known bodies per field (10−1–10−3) at all magnitudes. Points represent a sample from the distribution of known objects corresponding to one Euclid field extended to the full ecliptic latitude range and colored by orbit class. Hatched boxes show the searched regions. (b) Curves show injection-retrieval completeness per release.
Copyright and Terms & Conditions
© 2026. The Author(s). Published by the American Astronomical Society.

Copyright ©
2026 Astronomy Image Explorer. All Rights Reserved.
