

Image Details
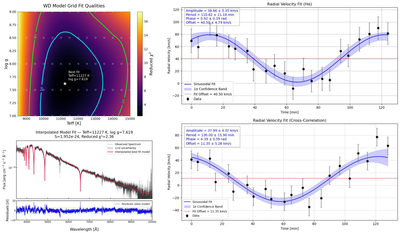
Caption: Figure 1.
Analysis of SDSS J1411. Top left: reduced-χ2 surface for Teff and ﹩\mathrm{log}g﹩ with 1σ (cyan) and 2σ (green) contours; the best fit is marked by a white star. Bottom left: LBT/MODS spectrum (black), best-fit model (red), and residuals. Top right: Hα RV curve with best-fit sinusoid (blue), 1σ band, and systemic velocity (dashed red). Bottom right: cross-correlation RVs against the best-fit template.
Copyright and Terms & Conditions
© 2026. The Author(s). Published by the American Astronomical Society.

Copyright ©
2026 Astronomy Image Explorer. All Rights Reserved.
