

Image Details
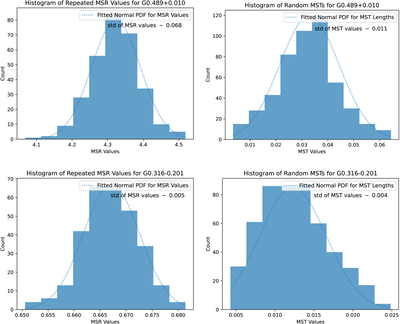
Caption: Figure 1.
(Left) The histograms for hundreds of sampled MSRs, demonstrating the CLT. The range shown is exceeded by A09 ’s SD; see Section 2. (Right) The histograms for the random sample of MSTs for an MSR. The SD given is s in ﹩\frac{\sigma }{{\ell }_{{\rm{Mass}}}\sqrt{K}}.﹩
Copyright and Terms & Conditions
© 2026. The Author(s). Published by the American Astronomical Society.

Copyright ©
2026 Astronomy Image Explorer. All Rights Reserved.
