

Image Details
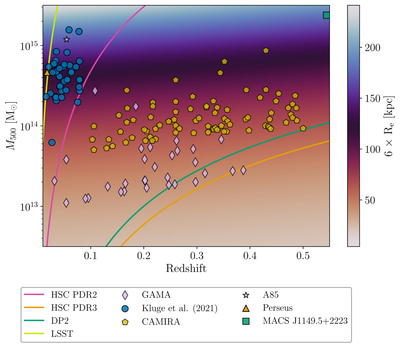
Caption: Figure 1.
Halo mass–redshift diagram comparing survey sky-subtraction scales with a diffuse extent of 6 × Re. Systems left of each curve are increasingly susceptible to sky oversubtraction. Literature cluster measurements are overplotted.
Copyright and Terms & Conditions
© 2026. The Author(s). Published by the American Astronomical Society.

Copyright ©
2026 Astronomy Image Explorer. All Rights Reserved.
