

Image Details
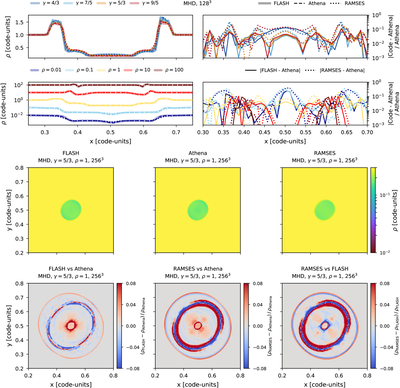
Caption: Figure 1.
The first two rows show density profiles (density versus position) at constant 1283 resolution, where FLASH is shown as solid translucent bands, Athena as dashed, medium bands, and RAMSES as dotted, thin lines. On the right of both line density profiles are their relative differences. The first row varies adiabatic index γ values (4/3, 7/5, 5/3, 9/5) at fixed ρ = 1. The second row considers five ambient densities (0.01, 0.1, 1, 10, 100) at γ = 5/3. The third row shows density slices at 2563 resolution with γ = 5/3 and ρ = 1 at 0.03 code-time. The last row shows signed difference maps, as colors across the plane, at 0.05 code-time.
Copyright and Terms & Conditions
© 2026. The Author(s). Published by the American Astronomical Society.

