

Image Details
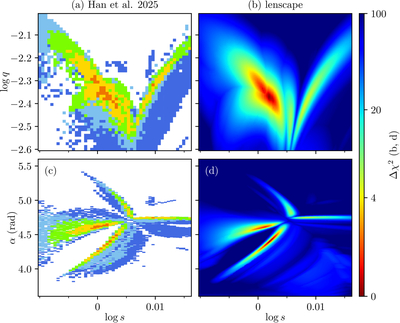
Caption: Figure 1.
Validation on the planetary microlensing event MOA-2022-BLG-091. Panels (a) and (c) show the published 50 × 50 maps (Figure 2 of C. Han et al. 2025) with discrete color bands at Δχ2 < 4, 8, 12, 16, and 20 (red to blue). Panels (b) and (d) display the continuous Δχ2 surfaces computed with lenscape at 400 × 400 resolution. Top row (a), (b): ﹩(\mathrm{log}s,\mathrm{log}q)﹩ plane. Bottom row (c), (d): trajectory angle α versus ﹩\mathrm{log}s﹩, with χ2 profiled over all remaining parameters (including q) at each grid point.
Copyright and Terms & Conditions
© 2026. The Author(s). Published by the American Astronomical Society.

Copyright ©
2026 Astronomy Image Explorer. All Rights Reserved.
