

Image Details
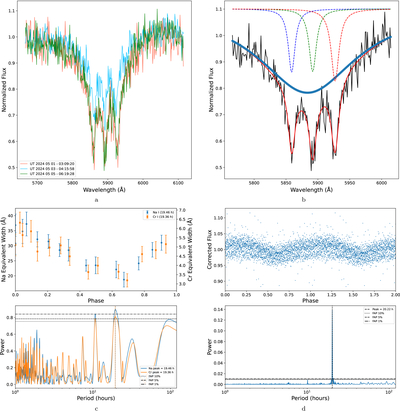
Caption: Figure 1.
(a) Comparison of normalized MMT spectra of LHS 2534, showing clear variability in the Na I absorption profile. (b) Lorentzian fit to the Na I absorption triplet, including the broad component used to account for its extended wings. (c) Phase-folded Na I and Cr I EWs from the MMT observations (top) and Lomb–Scargle periodograms of the MMT Na I and Cr I EW measurements (bottom). Horizontal lines indicate the 10%, 5%, and 1% false-alarm probability thresholds. The primary peaks occur at 19.46 hr for Na I and 19.36 hr for Cr I. Secondary spectroscopic peaks occur near 10.69 hr. (d) The K2 light curve (top) phase-folded at the photometric period of 20.22 hr, and Lomb–Scargle periodogram of the K2 photometry (bottom).
Copyright and Terms & Conditions
© 2026. The Author(s). Published by the American Astronomical Society.

